
by Matt Bandi
Embed from Getty Images
The 2015 MLB Draft kicks off tomorrow, an annual event that leads to dreams of future All-Stars and Hall of Famers. The draft is the lifeblood of major league teams, and one of the most frequently debated topics is how well organizations draft and develop talent.
For Pirates fans, the farm system was one of the few things worth following in the years leading up to their return to the postseason in 2013. Draft discussions probably peaked around 2012 or so, as Pirates fans and Pittsburgh media frequently debated whether the Neal Huntington-led front office was acquiring enough talent in the draft since taking over in September 2007. The problem with those discussions was often a lack of a proper point of reference, which led to comparisons to the extremes. In 2012, someone who felt the Pirates were not producing enough talent could easily point to the Cardinals’ success in the draft. At that point, the Cardinals’ 2008 and 2009 drafts had already produced Lance Lynn, Kevin Siegrist, Shelby Miller, Joe Kelly, Matt Carpenter, Trevor Rosenthal and Matt Adams. Each of those players was either producing at the big league level by 2012 or was on the verge of doing so. By 2012, Pedro Alvarez was the only Huntington draftee with any productive major league seasons under his belt. On the other hand, one could point to the Rays draft performance during that same period to praise the Pirates. By 2012, the Rays had not drafted a single big league player during Huntington’s tenure. They had also done a seemingly uninspiring job with a great opportunity in the 2011 draft, when they accumulated enough compensation picks to end up with 12 selections in the draft’s first two rounds.
These were two extreme situations, neither of which was a very useful comparison when discussing the Pirates. The 2009 Cardinals draft was historically good, and it was even the deserving subject of an oral history just five years later. Comparing the Pirates’ (or any team’s) drafts to that one was about as unfair as one could be. On the other hand, the Rays have had some dismal drafts in recent years, but that in itself was not a great reason to praise the Pirates. Those unproductive debates from a few years ago gave me the idea to take a look at what a league average team draft might look like.
I pulled together the results of the 1987 – 1999 amateur drafts, leaving me with 362 total team drafts.1 I chose 1987 as a starting point because that was the first year in which Major League Baseball included all amateur players in a single draft. Prior to that, previously unsigned players were drafted separately in a secondary draft, and that would have complicated my data collection. I cut things off at 1999 to allow enough time for all players to complete a substantial portion of their career. I tallied each player’s total FanGraphs WAR (fWAR)2 in their first seven major league seasons3, as I only wanted to consider performance before a player was capable of reaching free agency. (NOTE: Any reference to a particular player’s fWAR in this article is referring to his total in those first seven seasons.) Finally, I ignored the team(s) with which a player spent his major league career. I assigned each player to the team that drafted and signed him.
Here is a matrix showing the results for each team in each draft.
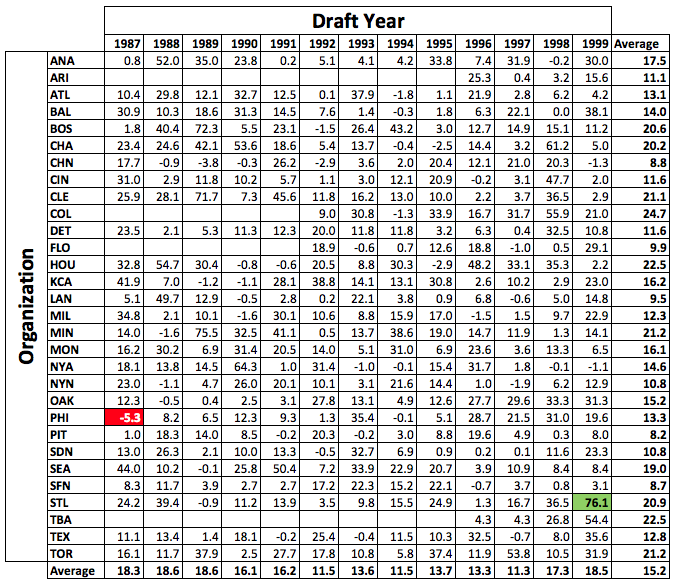
The average seven-year fWAR total per team draft class was 15.2 fWAR. That is the approximate equivalent of one everyday player per draft. As an example, Neil Walker will likely end up somewhere in the 14-16 fWAR range once he reaches seven years after the 2015 season.
The most productive organization over this period was the Rockies, who averaged 24.7 fWAR per draft. (There may be some sample size issues involved here, as the Rockies only had eight drafts during this period.) This was mainly driven by the drafting of superstars Todd Helton (1995, 33.2 fWAR) and Matt Holliday (1998, 32.2 fWAR) and several other solid everyday players. The least productive franchise, perhaps unsurprisingly, was the Pirates, who averaged only 8.2 fWAR per draft. The Pirates drafted an All-Star caliber player in Jason Kendall (1992, 22.8 fWAR) and a few decent starting pitchers in Kris Benson (1996, 13.5 fWAR), Bronson Arroyo (1995, 12.6 fWAR) and Tim Wakefield (1988, 10.2 fWAR). Otherwise, they mostly specialized in players best suited to be bench players and part-time starters.
The best individual draft over this period belonged to the Cardinals in 1999 (76.1 fWAR), when they picked up a future Hall of Famer in Albert Pujols (54.2 fWAR) and a good everyday player in Coco Crisp (16.4 fWAR). The least productive draft came courtesy of the Phillies in 1987 (-5.3 fWAR). The only players from that draft to top replacement level were Toby Borland (0.4 fWAR) and Jim Vatcher (0.2 fWAR). The overall total was dragged down significantly by third rounder Kim Batiste (-4.4 fWAR), who spent parts of five seasons in the big leagues despite very dismal offensive production. Somewhat surprisingly to me, no draft during this period resulted in zero major league players.
This is interesting information, but I wanted to explore these draft results in a slightly different way. Judging a draft class by total value is important, but the results can be dramatically altered by the success or failure of a single player. For example, it is pretty difficult to describe the Pirates 2005 draft as anything but a remarkable success, due to a first round pick by the name of Andrew McCutchen. However, the team produced little else of value with the 49 selections that followed. Fourth round pick Brent Lillibridge was shipped to Atlanta in the Adam LaRoche trade before reaching the Double-A level. He had a decent 2011 season as a bench player with the White Sox, but has been below replacement level for his career. Eighth round pick Steve Pearce spent several years as a Quad-A type player before a sudden career year in 2014 at age 31. No other players from the Pirates 2005 draft have reached the big leagues. The fruitless follow-up to the McCutchen selection most likely contributed (at least somewhat) to the team continuing to flounder along until 2013.
I broke down the above draft results into the following player type buckets. As a reminder, these fWAR totals only include a player’s first seven major league seasons. Included for each bucket is an example player to provide some context to the numbers, as well as the total number of players4 from our sample to fall in each category.
| Player Category | fWAR in first 7 seasons | Example Player | Total Players |
| Hall of Fame | 35.0 or greater | Frank Thomas (41.6 fWAR) | 7 |
| MVP | 25.0 – 34.9 | Carlos Beltran (28.7 fWAR) | 27 |
| All-Star | 20.0 – 24.9 | Tim Salmon (22.0 fWAR) | 34 |
| First Division Starter | 12.0 – 19.9 | Michael Young (15.0 fWAR) | 89 |
| Second Division Starter | 7.0 – 11.9 | Aubrey Huff (10.1 fWAR) | 136 |
| Bench | 3.0 – 6.9 | Todd Hollandsworth (4.9 fWAR) | 203 |
| Cup of Coffee | Less than 3.0 | Tike Redman (1.4 fWAR) | 1460 |
With 362 total team draft classes in our sample, here are the average results for every team’s draft.
| Category | Average Players Per Team Draft |
| Hall of Fame | 0.02 |
| MVP | 0.07 |
| All-Star | 0.09 |
| First Division Starter | 0.25 |
| Second Division Starter | 0.38 |
| Bench | 0.56 |
| Cup of Coffee | 4.04 |
As you can see, it is very difficult to consistently draft and develop impact talent. The average team nets fewer than one everyday player each year (combining the Second Division, First Division, All-Star, MVP and Hall of Fame buckets into a single everyday player category gives us an average of 0.81 players per team draft).
When I began this process, that 2009 Cardinals draft class was the gold standard in my mind. It was the draft that produced a star in Carpenter, a high upside starting pitcher in Miller, a quality everyday player in Adams, and a solid supporting cast in Rosenthal and Joe Kelly. Just looking at each player’s production to date and service time, this draft might end up producing one player in our MVP category (Matt Carpenter – 14.6 career fWAR, currently in his fifth MLB season), one in the First Division Starter category (Shelby Miller – 4.4 fWAR, fourth season), two in the Second Division Starter bucket (Trevor Rosenthal – 4.3 fWAR, fourth season; Matt Adams – 3.4 fWAR, fourth season) and one in the Bench category (Joe Kelly – 2.3 fWAR, fourth season).
It is hard to argue that any drafts in our 1987-1999 sample were better than that class if the above holds true, at least when looking at overall depth. That 1999 Cardinals draft will likely end up producing four players that would fall in the Second Division Starter category or better, a feat matched only once between 1987 and 1999 (Blue Jays, 1997). Here are the only drafts in our sample that produced at least three Second Division Starters or better. Each player’s fWAR is in parentheses. I also included the team’s first pick in that year’s draft, to provide some context regarding the advantage of selecting earlier in the draft.
| Year | Team | First Team Selection | Players (7.0+ fWAR) |
| 1987 | Milwaukee Brewers | 13 | Jaime Navarro (18.4) Steve Sparks (9.4) Troy O’Leary (7.1) |
| 1988 | California Angels | 8 | Jim Abbott (21.4) Jim Edmonds (19.5) Damion Easley (7.8) |
| 1988 | St. Louis Cardinals | 22 | Brian Jordan (19.2) Rheal Cormier (10.4) Mark Clark (8.4) |
| 1989 | Cleveland Indians | 11 | Brian Giles (26.2) Jim Thome (21.0) Curtis Leskanic (7.2) |
| 1989 | Boston Red Sox | 16 | Jeff Bagwell (42.3) Mo Vaughn (21.4) Paul Quantrill (8.2) |
| 1989 | Minnesota Twins | 25 | Chuck Knoblauch (33.6) Scott Erickson (20.1) Denny Neagle (15.2) |
| 1990 | Chicago White Sox | 4 | Alex Fernandez (20.9) Ray Durham (11.9) James Baldwin (9.7) |
| 1990 | New York Yankees | 10 | Andy Pettitte (29.8) Jorge Posada (18.3) Carl Everett (11.7) |
| 1991 | Seattle Mariners | 11 | Derek Lowe (18.6) Shawn Estes (13.4) Darren Bragg (8.5) |
| 1992 | Kansas City Royals | 10 | Jon Lieber (18.9) Johnny Damon (13.8) Michael Tucker (8.5) |
| 1993 | San Diego Padres | 14 | Matt Clement (12.4) Derrek Lee (11.0) Gary Matthews (9.9) |
| 1993 | Colorado Rockies | 28 | John Thomson (16.7) Jamey Wright (7.8) Bryan Rekar (7.1) |
| 1997 | Toronto Blue Jays | 5 | Michael Young (15.0) Orlando Hudson (14.9) Vernon Wells (12.6) Mark Hendricks (11.3) |
| 1998 | Cincinnati Reds | 7 | Adam Dunn (19.6) Austin Kearns (15.9) B.J. Ryan (7.9) |
| 1998 | Chicago White Sox | 16 | Mark Buehrle (25.4) Aaron Rowand (20.1) Kip Wells (10.2) |
| 1999 | Texas Rangers | 38 | Aaron Harang (16.8) Hank Blalock (10.2) Kevin Mench (8.5) |
Conversely, there are a few possible choices for the coveted title of least productive draft in our sample. Here are the draft classes that only produced a single Cup of Coffee player. Again, each player’s fWAR is in parentheses.
| Year | Team | First Team Selection | Player |
| 1992 | Los Angeles Dodgers | 32 | Keith Johnson (0.2) |
| 1992 | San Diego Padres | 55 | Todd Erdos (-0.5) |
| 1996 | Cincinnati Reds | 25 | Buddy Carlyle (-0.2) |
| 1996 | San Diego Padres | 15 | Jason Middlebrook (0.2) |
| 1998 | Anahem Angels | 18 | Seth Etherton (-0.2) |
On average, there are only about five players per draft that ultimately end up in the All-Star category or better, and only about 23 players per draft that could be considered everyday players. Of the 1,956 big league players in our sample, about 85% were Cup of Coffee guys, and another 10% or so only managed to reach the Bench level.
This is yet another reminder of how difficult the game of baseball is, both for the players attempting to achieve their dream of becoming successful big leaguers and for members of the front office and management team who are trying to draft and develop impact big league talent.
1. Because they were expansion teams, the Rockies, Marlins, Diamondbacks and Rays did not have the full 13 drafts during this sample.↩
2. I initially began collecting the raw data for this study about a year ago, and worked on it off and on whenever I had some free time. A few months ago, FanGraphs made some slight modifications to their fWAR calculations. Unfortunately, I have not had the time to go back and do the research a second time, so there will be some minor differences between the data in this article and what you will currently see on the FanGraphs website.↩
3. Due to my personal limitations with writing code, these numbers only include the seven consecutive years beginning with a player’s debut, as opposed to the player’s first seven seasons with major league playing time. This will cause some minor issues with certain players. For example, Xavier Nady had one plate appearance in 2000, but did not return to the majors again until 2003. So this data only includes his numbers from 2000 – 2006, instead of 2000, 2003-2008.↩
4. Mike Lansing and Paul Carey were removed from this sample because they were originally drafted and signed by the Miami Miracle, an independent minor league team playing in the Florida State League, in 1990. Not knowing how to handle this, I just removed them.↩
Here is a link to download the data I collected, in case anyone would like to play around with it a bit.
Data (Excel)
Sources:
Baseball-Reference
FanGraphs
Retrosheet

Pingback: Discover: Draft Day delivery « MLB.com Blogs